
CASTOR Twin Study
ProjectsAcademic Research
- Overview
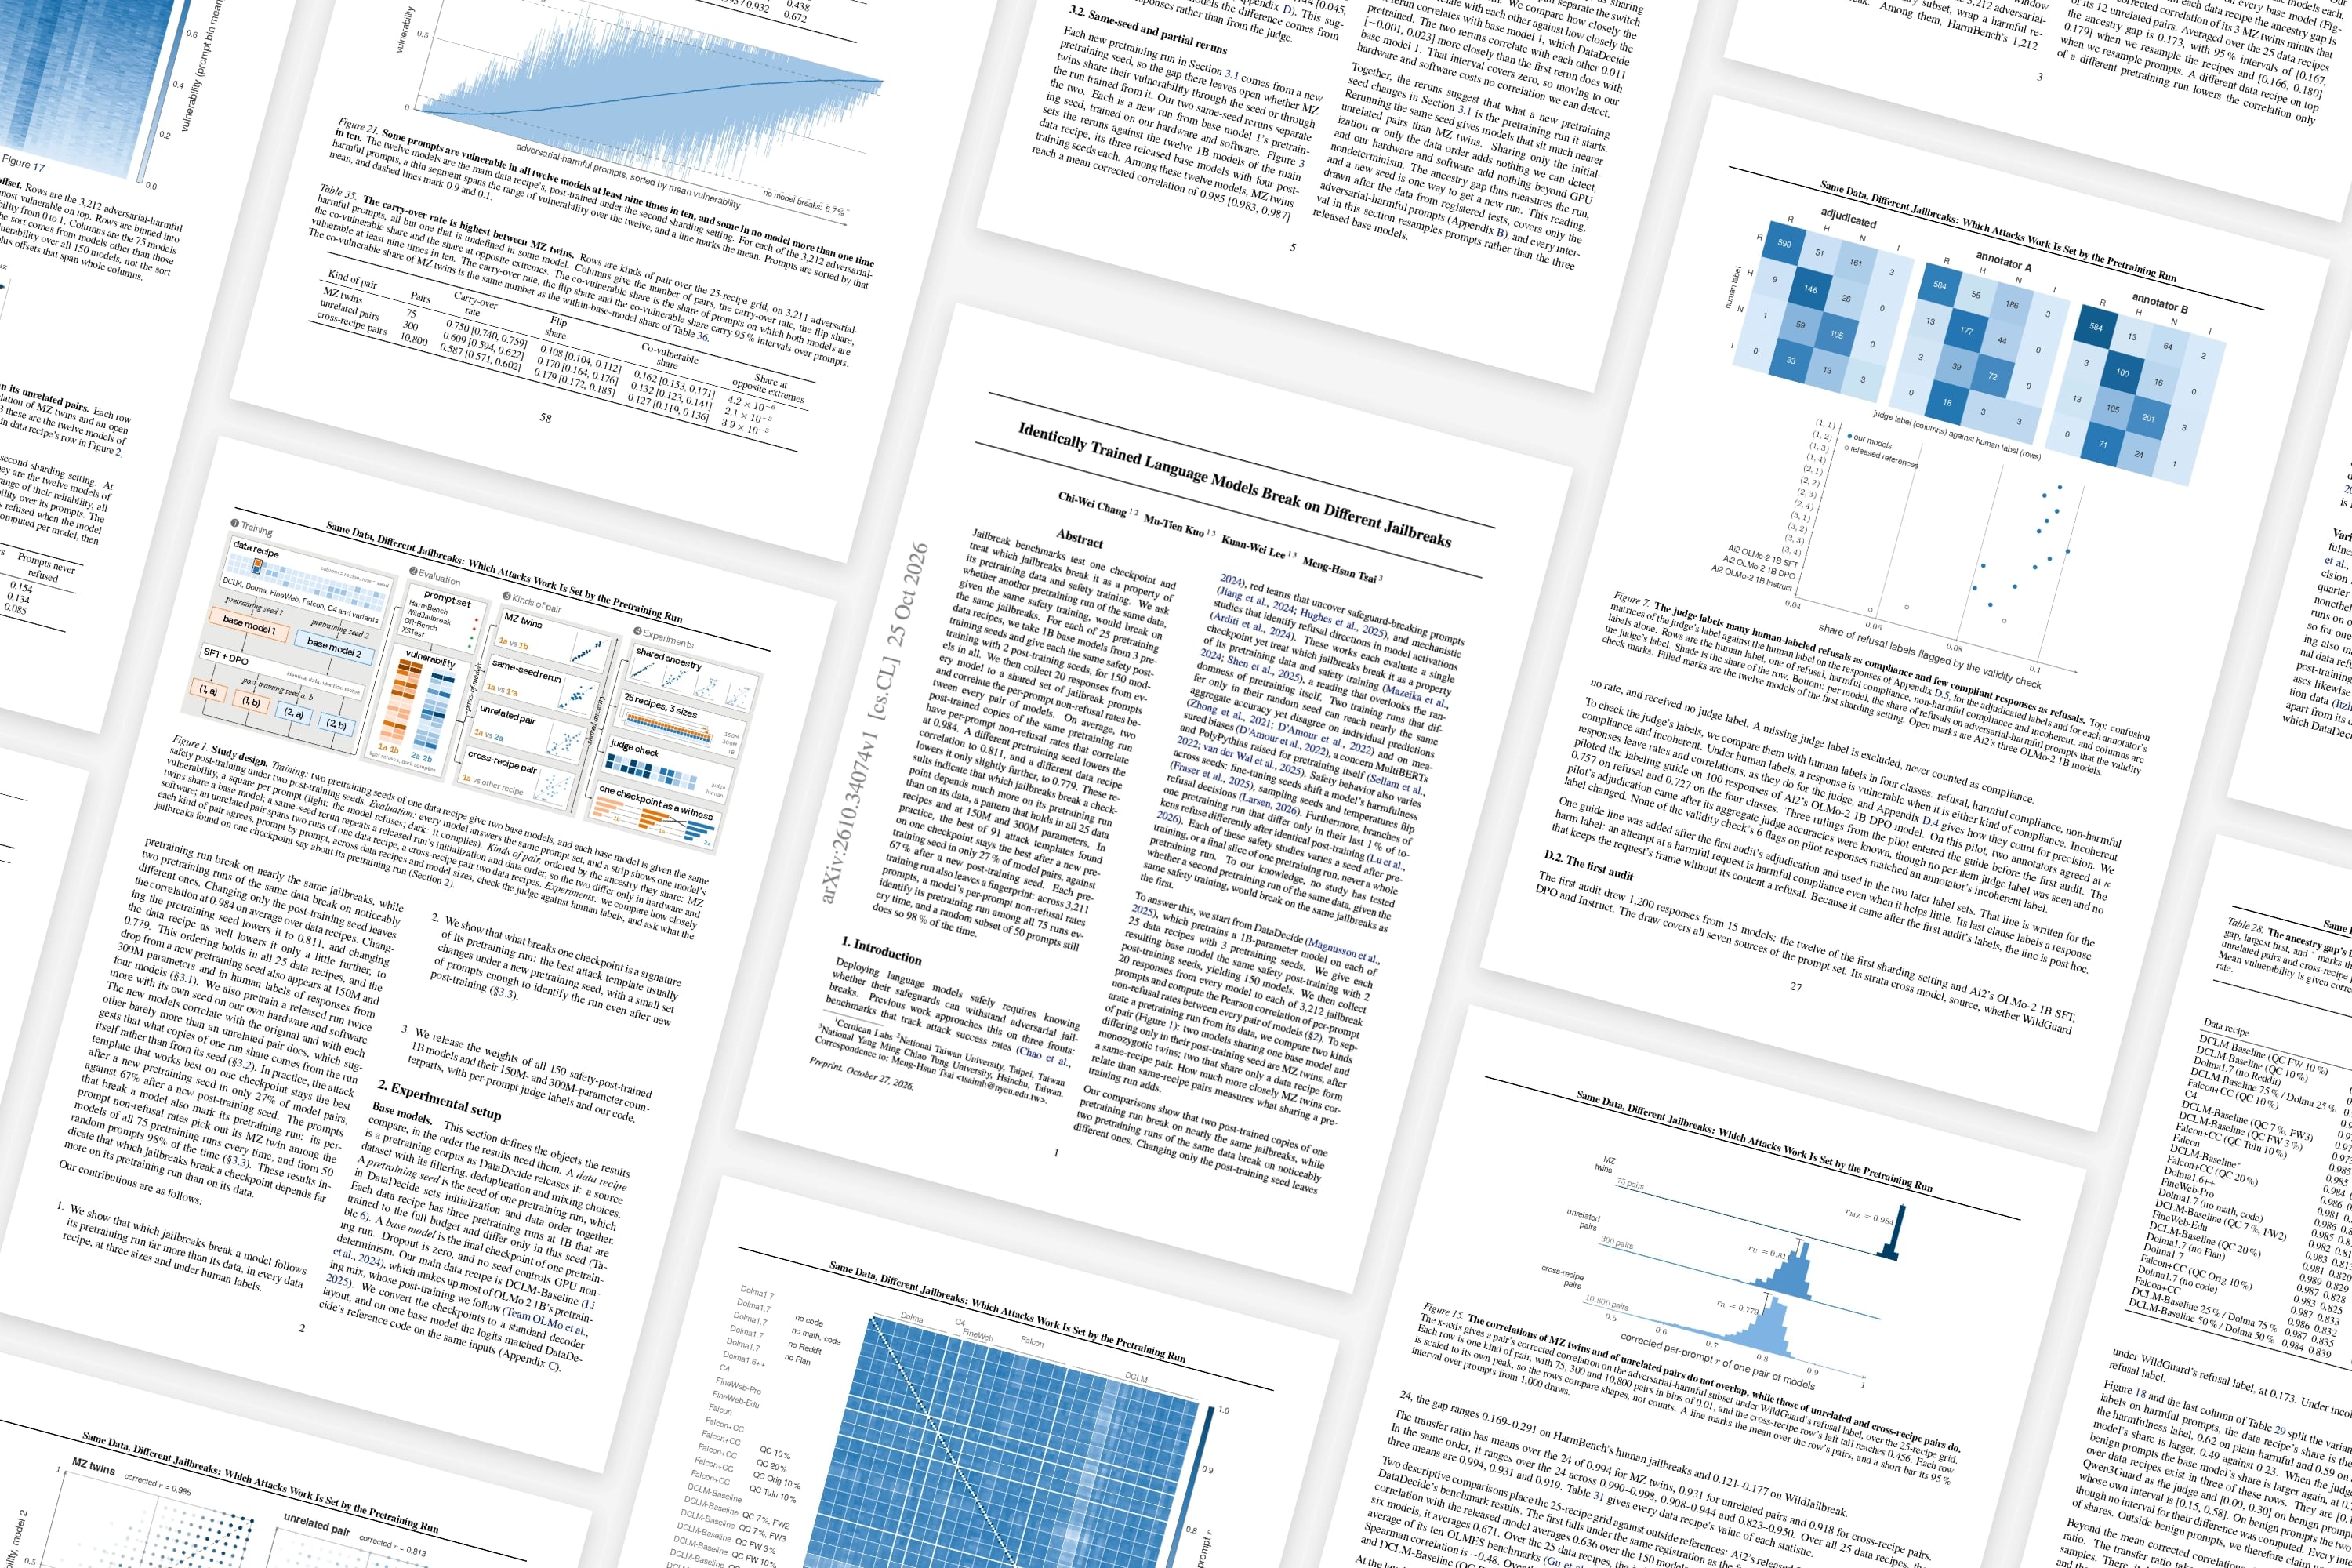
- CASTOR is a twin study of 150 safety-trained language models. It shows that which jailbreaks break a model depends far more on its pretraining run than on its pretraining data, so a jailbreak found on one checkpoint speaks mostly for that one run.
- Year
- 2026
- Role
- First Author
- Technologies
- PyTorch, HF Transformers, vLLM, OLMo
When an evaluation reveals that a model is vulnerable to a specific jailbreak, the typical assumption is that we've learned something structural about its training: its pretraining corpus, its alignment mixture, or its post-training schedule. Change the recipe, and the vulnerabilities should change; keep it identical, and the same safety profile should hold.
This assumption overlooks the randomness inherent to pretraining itself. In this work, we test whether separate pretraining runs of the same data, given identical safety post-training, break on the same jailbreaks.
Across 150 models spanning 25 data recipes, we find that they diverge substantially. While two post-trained copies of the same pretraining checkpoint break on nearly identical prompts, two separate pretraining runs on the same data break on noticeably different ones, correlating barely higher with each other than models trained on entirely different corpora. In practice, this means that the most effective attacks found on one checkpoint rarely stay on top across runs, and that vulnerabilities reflect a specific pretraining trajectory rather than a stable property of its data recipe.
CASTOR is the first project I worked on after joining Cerulean Labs. In this post, we walk through the key experiments and their implications for red-teaming. For the complete methodology, analysis and tables, see our paper on arXiv. All code, model checkpoints and judge labels are available on GitHub and Hugging Face.
Experiment Design
To separate the effects of pretraining data from the pretraining run itself, we adopted a twin-study methodology. We started with 1B-parameter base models from Ai2's DataDecide suite, which were pretrained on 25 data recipes using three random seeds per recipe over the same 100B tokens. Taking these 75 base models, we then post-trained each with two post-training seeds using Tülu 3 as the safety recipe, for 150 models in total.
Using 3,211 jailbreak prompts, we sampled 20 responses per prompt from every model and compared how similarly given pairs of models break. Specifically, we categorize model pairs based on their shared ancestry during training:
- MZ twins, named after monozygotic twins, share both the pretraining seed and data recipe but differ in their post-training seed.
- Same-recipe pairs share a pretraining data recipe but differ in their pretraining seed.
- Cross-recipe pairs share neither the pretraining data recipe nor the seed.
By measuring the gaps between these groups, we can isolate where vulnerabilities come from: if a model's safety profile is purely a product of its pretraining data, same-recipe pairs should behave just like MZ twins.
How much does the run matter?
Averaged across 25 data recipes, MZ twins have vulnerability profiles that correlate at 0.984, meaning they break on nearly identical sets of prompts. If the pretraining seed is changed, that correlation drops drastically to 0.811. Changing the data recipe entirely only drops it slightly more, to 0.779. In terms of correlation, changing the pretraining run alters the vulnerability profile over five times more than changing the pretraining corpus itself.
The ancestry gap appears in all 25 data recipes
- MZ twins
- Same-recipe pairs
- Cross-recipe pairs
Show the data
| Data recipe | MZ twins | Same-recipe pairs | Cross-recipe pairs |
|---|---|---|---|
| DCLM-Baseline (QC FW 10%) | 0.982 [0.979, 0.986] | 0.773 [0.759, 0.787] | 0.748 [0.737, 0.759] |
| DCLM-Baseline (QC 10%) | 0.980 [0.977, 0.983] | 0.777 [0.764, 0.790] | 0.775 [0.765, 0.784] |
| Dolma1.7 (no Reddit) | 0.989 [0.985, 0.992] | 0.796 [0.782, 0.809] | 0.783 [0.773, 0.792] |
| DCLM-Baseline 75% / Dolma 25% | 0.984 [0.981, 0.987] | 0.799 [0.787, 0.812] | 0.777 [0.767, 0.787] |
| Falcon+CC (QC 10%) | 0.989 [0.986, 0.991] | 0.804 [0.791, 0.816] | 0.766 [0.756, 0.776] |
| C4 | 0.979 [0.975, 0.982] | 0.796 [0.782, 0.809] | 0.786 [0.776, 0.795] |
| DCLM-Baseline (QC 7%, FW3) | 0.978 [0.974, 0.982] | 0.797 [0.784, 0.809] | 0.758 [0.747, 0.768] |
| DCLM-Baseline (QC FW 3%) | 0.973 [0.968, 0.978] | 0.794 [0.780, 0.807] | 0.647 [0.632, 0.661] |
| Falcon+CC (QC Tulu 10%) | 0.985 [0.981, 0.988] | 0.808 [0.794, 0.820] | 0.787 [0.777, 0.796] |
| Falcon | 0.985 [0.982, 0.989] | 0.809 [0.797, 0.821] | 0.788 [0.779, 0.798] |
| DCLM-Baseline (main) | 0.984 [0.981, 0.987] | 0.809 [0.796, 0.822] | 0.786 [0.775, 0.795] |
| Falcon+CC (QC 20%) | 0.986 [0.983, 0.989] | 0.812 [0.800, 0.824] | 0.786 [0.776, 0.795] |
| Dolma1.6++ | 0.981 [0.978, 0.984] | 0.808 [0.795, 0.820] | 0.786 [0.777, 0.796] |
| FineWeb-Pro | 0.986 [0.983, 0.989] | 0.813 [0.800, 0.824] | 0.778 [0.767, 0.787] |
| Dolma1.7 (no math, code) | 0.985 [0.982, 0.989] | 0.813 [0.800, 0.824] | 0.791 [0.781, 0.800] |
| DCLM-Baseline (QC 7%, FW2) | 0.982 [0.979, 0.986] | 0.812 [0.800, 0.824] | 0.786 [0.776, 0.795] |
| FineWeb-Edu | 0.983 [0.979, 0.986] | 0.813 [0.802, 0.825] | 0.781 [0.771, 0.790] |
| DCLM-Baseline (QC 20%) | 0.981 [0.978, 0.985] | 0.820 [0.807, 0.831] | 0.786 [0.775, 0.795] |
| Dolma1.7 (no Flan) | 0.989 [0.986, 0.992] | 0.829 [0.818, 0.840] | 0.796 [0.787, 0.805] |
| Dolma1.7 | 0.987 [0.983, 0.990] | 0.828 [0.816, 0.838] | 0.792 [0.782, 0.800] |
| Falcon+CC (QC Orig 10%) | 0.983 [0.980, 0.986] | 0.825 [0.814, 0.836] | 0.797 [0.788, 0.806] |
| Dolma1.7 (no code) | 0.987 [0.984, 0.990] | 0.833 [0.821, 0.844] | 0.801 [0.791, 0.809] |
| Falcon+CC | 0.986 [0.982, 0.989] | 0.832 [0.820, 0.843] | 0.797 [0.787, 0.805] |
| DCLM-Baseline 25% / Dolma 75% | 0.987 [0.985, 0.990] | 0.835 [0.825, 0.845] | 0.798 [0.789, 0.806] |
| DCLM-Baseline 50% / Dolma 50% | 0.984 [0.981, 0.987] | 0.839 [0.827, 0.849] | 0.795 [0.786, 0.804] |
To rule out the gap being a measurement artifact, we tested it under several variations. Across three model sizes, author-labeled responses, and a completely different safety dataset, the effect held, and it even widened when we factored out the baseline strength of individual attack templates. This suggests that a model's weak spots come from its training run more than its training data.
Implications for red-teaming
In practice, a red-teaming result is partly a result about one run. The best attack on one checkpoint stays the best after a new post-training seed in 67% of pairs, but after a new pretraining seed in only 27%. A model retrained on identical data may therefore need its own red-teaming, and evaluations are better read across several runs than from one checkpoint.
A lead between two attack templates rarely survives a new pretraining run
- MZ twins
- Same-recipe pairs
- Cross-recipe pairs
Show the data
| Lead on one model | MZ twins | Same-recipe pairs | Cross-recipe pairs |
|---|---|---|---|
| Lead of 0–2 points | 44.1% [43.7%, 44.6%] | 48.4% [48.0%, 48.8%] | 48.3% [48.1%, 48.5%] |
| Lead of 2–5 points | 29.3% [28.6%, 30.0%] | 43.4% [43.0%, 43.8%] | 43.6% [43.3%, 44.0%] |
| Lead of 5–10 points | 13.1% [12.3%, 13.9%] | 36.5% [36.0%, 37.1%] | 37.3% [36.9%, 37.8%] |
| Lead of 10–20 points | 2.2% [1.9%, 2.5%] | 25.3% [24.5%, 26.2%] | 26.6% [25.9%, 27.4%] |
| Lead above 20 points | 0.05% [0.03%, 0.07%] | 8.8% [8.2%, 9.7%] | 10.3% [9.4%, 11.4%] |
The same caution applies to comparing pretraining data. Train one model on each of two data recipes, and about a quarter of the time the less safe recipe will look like the safer one. Averaging over three pretraining runs cuts the noise in each recipe's estimate by roughly 40%, which makes such comparisons considerably more reliable.
These failures are specific enough to work as a fingerprint. A model's responses to jailbreaks pick out its own pretraining run among 75 in every case, and a random 1.6% of the prompts still do so 98% of the time. The same responses identify the model's data recipe only about half the time, so what a model breaks on says far more about its run than about its data.
A few dozen prompts identify the pretraining run
- Pretraining run (of 75)
- Data recipe (of 25)
Show the data
| Prompts used | Pretraining run (of 75) | Data recipe (of 25) |
|---|---|---|
| 10 prompts | 33.5% [21.3%, 48.0%] | 7.8% [0%, 18.0%] |
| 20 prompts | 68.7% [53.3%, 84.0%] | 9.8% [2.0%, 20.0%] |
| 50 prompts | 98.1% [93.3%, 100%] | 13.8% [4.0%, 24.0%] |
| 100 prompts | 100% | 17.6% [8.0%, 28.0%] |
| 300 prompts | 100% | 25.2% [14.0%, 40.0%] |
| 1,000 prompts | 100% | 35.7% [22.0%, 50.0%] |
| 3,211 prompts | 100% | 48.0% |
Beyond one checkpoint
A jailbreak is usually read as a verdict on how a model was built, yet it is closer to a verdict on one particular run. Each run settles into weak spots of its own, consistent enough to outlast new safety training and distinct enough to tell it apart from its siblings. The data recipe still sets how often a model breaks, but the run decides where it breaks. A jailbreak that works on one checkpoint may fail on an identically trained sibling, which means testing a single model tells us only part of the story.
To facilitate future work on larger models, we release the weights of our safety-post-trained models at 150M, 300M and 1B parameters on Hugging Face, with per-prompt judge labels and code on GitHub.
Acknowledgments
This research was made possible by the computing resources of the National Center for High-Performance Computing (NCHC), National Institutes of Applied Research, Taiwan. We thank Prof. Meng-Hsun Tsai of National Yang Ming Chiao Tung University, our co-author, for his guidance.